


Profiling with Instruments
 Instruments and DTrace are extremely valuable tools for
inspecting your software and to track down problems. Be it
memory leaks or performance bottlenecks. Let me walk you through
a real profiling session here.
Instruments and DTrace are extremely valuable tools for
inspecting your software and to track down problems. Be it
memory leaks or performance bottlenecks. Let me walk you through
a real profiling session here.
 Sometimes I was surprised about how long it takes for the
FeedbackReporter
dialog to come up. While I have already suspected from the logs
this might be related to the console log gathering I gave the
CPU Sampler template in Intruments a go. From inside
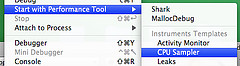
Xcode you can just pick it from
Start with Performance Tool. It fires up Intruments and
while you use you application it records the
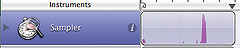
application’s activity. As you can see from
the timeline there was a big spike when opening the
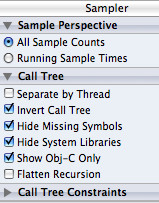
FeedbackReporter dialog. After I tweaked the
Call Tree settings it clearly showed the callstack and
with it – the method that uses up more than 70% of the CPU
time.
 Obviously +[ConsoleLog:logSince:] is quite busy here.
Unfortunately Instruments does not show exactly busy with what.
(I wish you could just drill down further!) So in order to dig a
little deeper you can create a custom instrumentation.
Obviously +[ConsoleLog:logSince:] is quite busy here.
Unfortunately Instruments does not show exactly busy with what.
(I wish you could just drill down further!) So in order to dig a
little deeper you can create a custom instrumentation.
I am only interested of what happens inside the
ConsoleLog class. The code in
+[ConsoleLog:logSince:] basically just calls out to the
Apple System Logger. So only those functions I care
about.
objc9447:ConsoleLog::entry
{
        self->follow = 1;
}
pid9447::asl_*:entry
/self->follow/
{
        printf("%Y %s %s\n", walltimestamp, probemod, probefunc);
}
objc9447:ConsoleLog::return
/self->follow/
{
        self->follow = 0;
}
The above DTrace script shows how to print a timestamp on all ASL calls within ConsoleLog. (You can run it with “sudo dtrace -s mytrace.d”. But you have to adjust the pid first!) It creates a context to reduce the number of probes and then filters on all method entries that start with “asl_”. To be more precise you would probably also want to record return not just the entry times as well. But that’s good enough for now.
While I am a terminal guy myself you can also model this script
inside instruments. Create a new instrumentaion and then add the
different parts of the script like this:
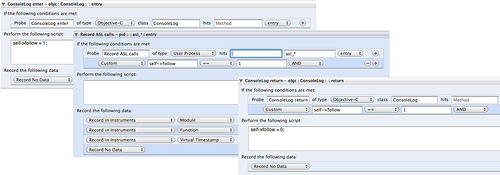
When you now run another Instruments session you get the timestamps of all the different ASL calls.
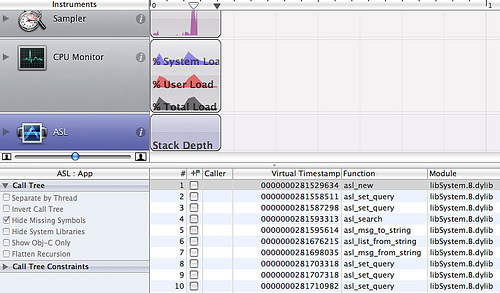
There is a lot of things you can do with DTrace and Instruments. I hope this helped you get started. For FeedbackReporter it means that querying the ASL subsystem can be quite slow. It would be better to run it in the background. Well, maybe in the next release :)